s36-B Filtered stop order, 20R target
NAS100 · 1m chart · a variation of First 1m candle · paper account since 2026-11-02
The same order, with the stop 0.044% from the candle's close and a 20R target.
Backtest 2019-today: 265 trades, 17% wins, +373.1R, largest drop 19.3R. 2019-23 +196.5R, 2024-26 +176.5R, 2026 so far +67.9R.
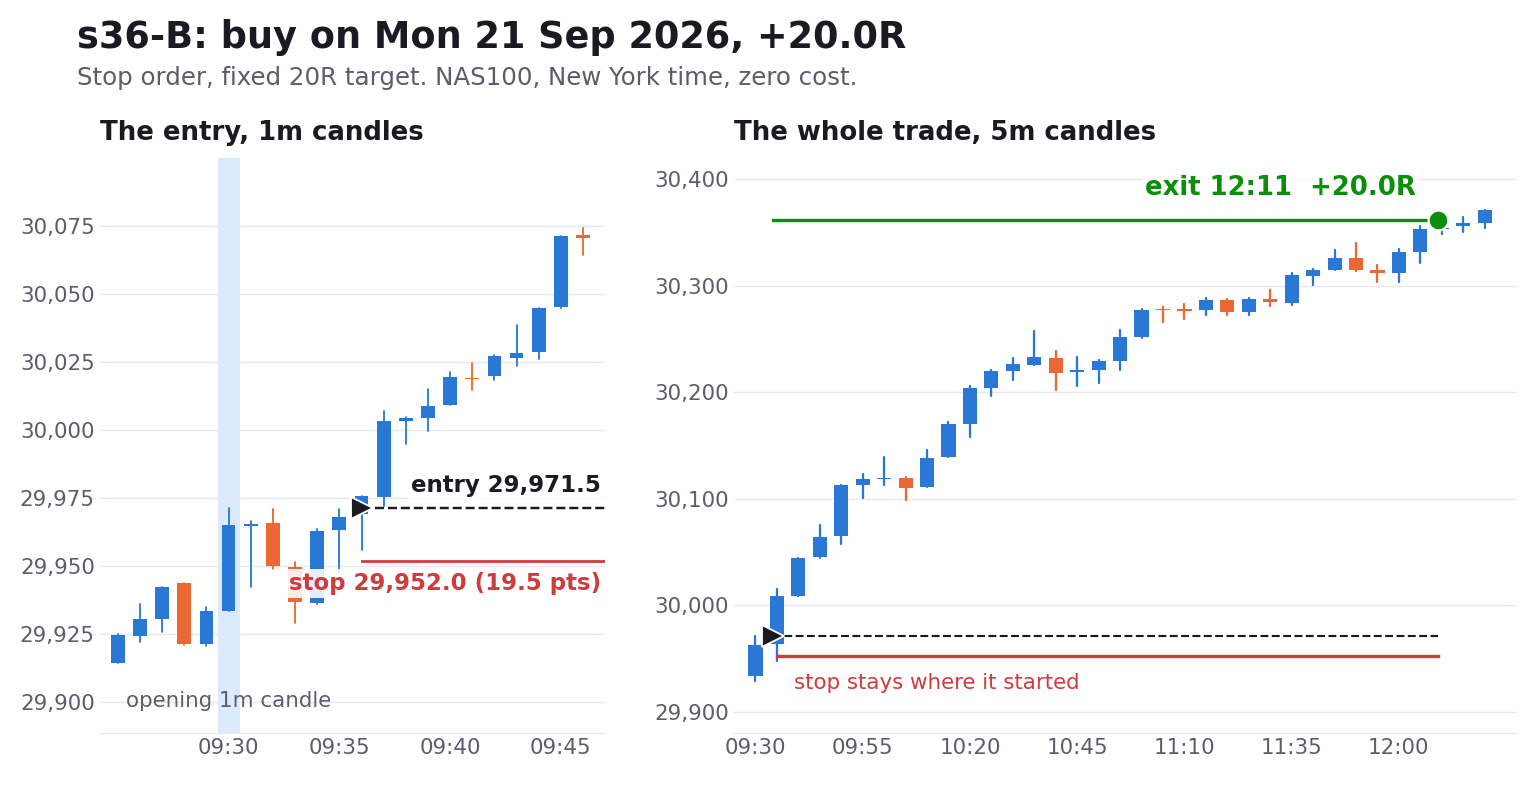
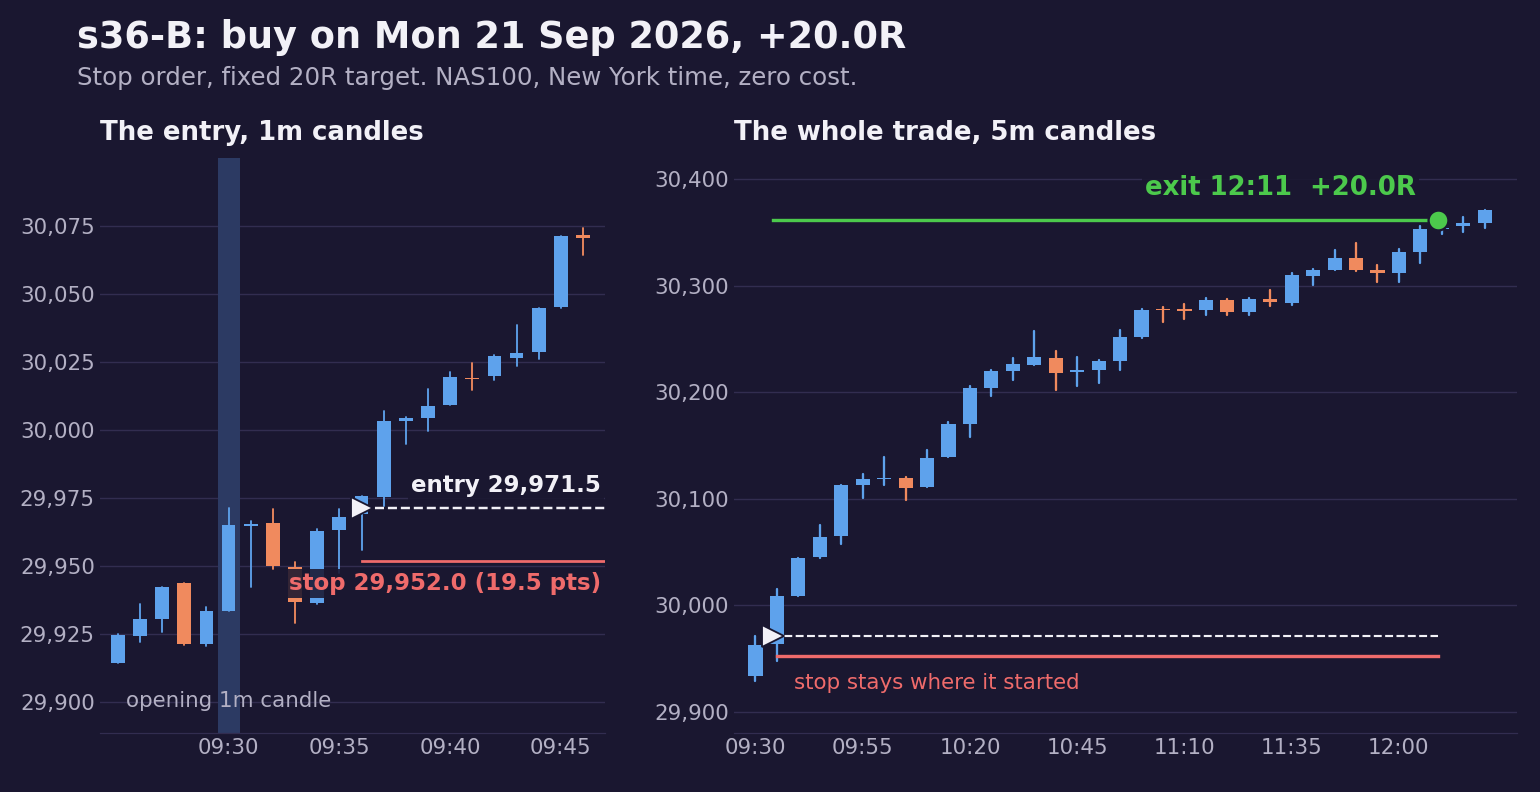
The rules it shares with every variation are on the strategy page.
| Setting | Strategy default | s36-B (this) | s36-D (main) |
|---|---|---|---|
| Stop The middle of the candle, or the base stop from its close. | mid | close | close |
| Target (R) Profit target in R. Off when the stop trails. | off | 20 | off |
| Trail starts at (R) The stop starts trailing after this profit, from the next candle. | 5 | off | 10 |
| Trail distance (R) How far the stop stays behind the best price. | 5 | off | 10 |
| Entry A stop order beyond the opening candle, or a market order at its close. | break | break | close |
All 23 settings of s36-B
Direction = bothEntry = breakWick rule = noFilter = yesSmallest body = 0.7Largest noise = 0.8Base stop = 0.0004385964912280702Stop = closeOrder until = 10:00Target (R) = 20Trail starts at (R) = offTrail distance (R) = offFlat at = 16:00tp r = 2use be = nobe trigger r = 1.5sl atr mult = 0stop steps = []trail start r = offtrail dist r = 1use tp = nopartial r = offpartial frac = 0.5Balance (R)
Calendar
Closed trades
| Year | Trades | Win % | Result |
|---|---|---|---|
| 2019 | 46 | 17% | +58.6R |
| 2020 | 26 | 8% | −1.3R |
| 2021 | 39 | 21% | +89.0R |
| 2022 | 2 | 0% | −2.0R |
| 2023 | 48 | 15% | +52.2R |
| 2024 | 42 | 10% | +26.7R |
| 2025 | 47 | 21% | +82.0R |
| 2026 | 15 | 40% | +67.9R |
Dukascopy data until 2026-10-05, in R at zero cost (R = the amount risked on a trade). Your own spread, commission, account and risk go in the Money calculator tab. Settings were partly chosen by looking at this history, so the live account is the real test.
Turn the backtest's R into money for your own account: starting balance, risk per trade (fixed or compounding) and your broker's costs. Nothing else on the site uses money.
Balance after each trade
| Year | Trades | R before costs | R after costs | Profit | Return |
|---|---|---|---|---|---|
| 2019 | 46 | +58.6R | +47.8R | +$4,784 | +47.8% |
| 2020 | 26 | −1.3R | −5.9R | −$595 | −4.0% |
| 2021 | 39 | +89.0R | +84.3R | +$8,426 | +59.4% |
| 2022 | 2 | −2.0R | −2.2R | −$224 | −1.0% |
| 2023 | 48 | +52.2R | +46.2R | +$4,622 | +20.6% |
| 2024 | 42 | +26.7R | +22.6R | +$2,259 | +8.4% |
| 2025 | 47 | +81.9R | +78.1R | +$7,815 | +26.7% |
| 2026 | 15 | +67.9R | +67.0R | +$6,695 | +18.1% |
Replays the backtest trades with raw costs: 1.00 spread. A trade's cost in R = cost ÷ its stop distance, so tight stops pay more R. Risk is set when a trade opens; trades can overlap, like the backtest. Year = the year the trade opened (UTC); return = profit ÷ the balance at the year's first trade. Not included: swap / overnight financing, taxes. Past results, not a forecast.
This variation's backtest trades on a prop firm account: pick a firm, an account size, a period and your risk per trade. Costs come from the Money calculator tab (now: raw costs: 1.00 spread).
FTMO · 2-Step Challenge: Target 10% then 5% · max loss 10% fixed · daily loss 5% · min 4 trading days · 80% split · first payout after 14 days · $96 fee · fee refunded with payout #1.
Not simulated: Fees are EUR (€89-€1,080) at ~1.08 USD. Funded Standard account: no orders 2 min around major news, no holding over weekends (Swing account exempt).
Rules checked against the firm's site on 2026-10-28; firms change them often.
Net cash over time (payouts − fees)
Every account (3)
| # | Bought | Ended | Result | Trades | Time to pass | Payouts | Received | Fees |
|---|---|---|---|---|---|---|---|---|
| 3 | 2024-11-25 | – | Funded, still open | 69 | 8.2 months · 26 tr | 8 | +$3,469 | −$96 |
| 2 | 2023-11-06 | 2024-11-25 | Blown when funded | 47 | 6.5 months · 22 tr | 1 | +$555 | −$96 |
| 1 | 2019-01-15 | 2023-11-06 | Blown when funded | 149 | 10.3 months · 40 tr | 14 | +$5,096 | −$96 |
Replays this variation's backtest trades (raw costs: 1.00 spread) from 2019-01-15 to 2026-09-23, risking a fixed 0.5% of the account size per trade. A blown account is replaced at once; payouts are taken as soon as the rules allow. Floating losses use each trade's worst point on its own (open trades are not added together); the trading day runs 17:00 to 17:00 New York. Futures firms are simulated with the CFD backtest in R. Past results, not a forecast.